The new version of Simone 2.3 is now available
What’s new in SimOne2.3
Monte-Carlo / Worst Case Analysis
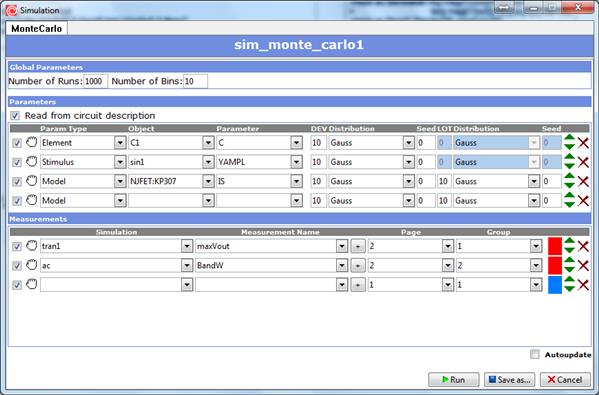
Monte-Carlo analysis performs multiple runs of a certain type of analysis (e.g. Transient) with different values of specified parameters (of elements, component models, stimuli or global parameters). For each run the values are randomly chosen within the user-specified ranges according to selected probability distributions. Performance characteristics are calculated and presented graphically as histograms. A set of graphical plots corresponding to the chosen analysis type.
Monte-Carlo parameters window
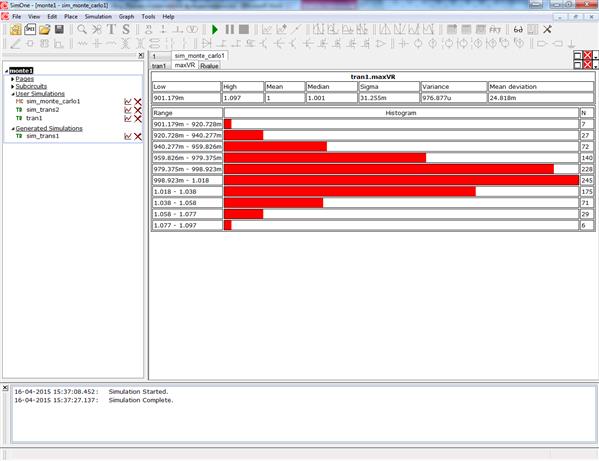
Performance characteristic hystogram
For the Worst Case analysis the WCase and AWCase distributions are chosen. In this case for each run only the border values of the parameter are selected.
Sensitivity Analysis
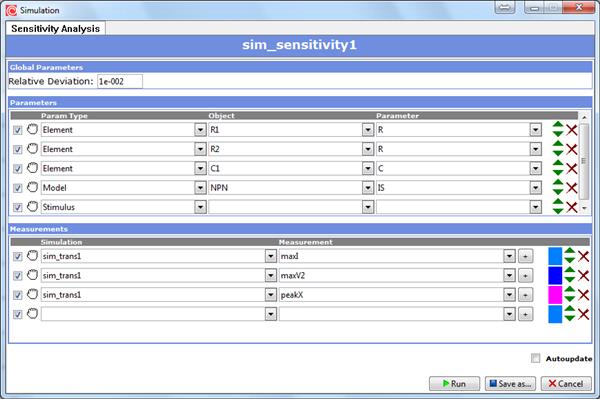
Sensitivity analysis is used for determining what influence parameters of circuit components have on one or more output expressions. Sensitivity analysis is usually performed before the circuit optimisation, since it helps to choose among the parameters to be varied, thus increasing the speed and effectiveness of the optimisation. As well it helps to find the parameters, which have the most influence on performance characteristics, the results being used in Monte-Carlo/Worst Case.
Sensitivity analysis parameters window
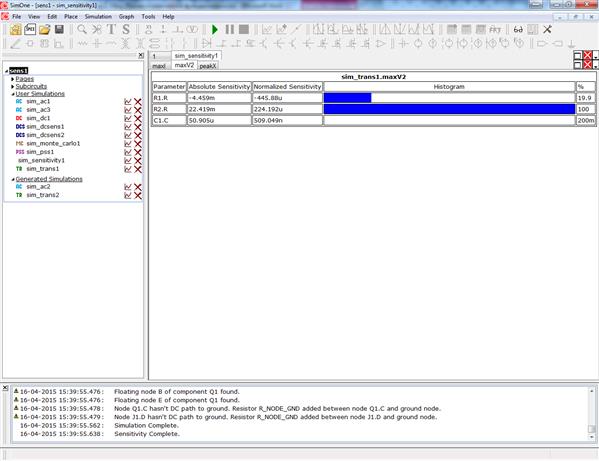
The sensitivity analysis results for each measurement are presented in an individual tab. In the table the absolute and normalised sensitivities are given. The histogram for the chosen sensitivity (absolute or normalised) is displayed. It can be switched with the corresponding button.
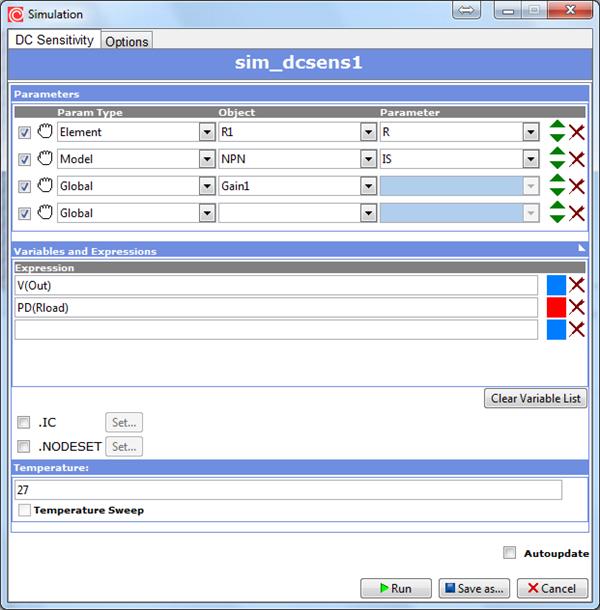
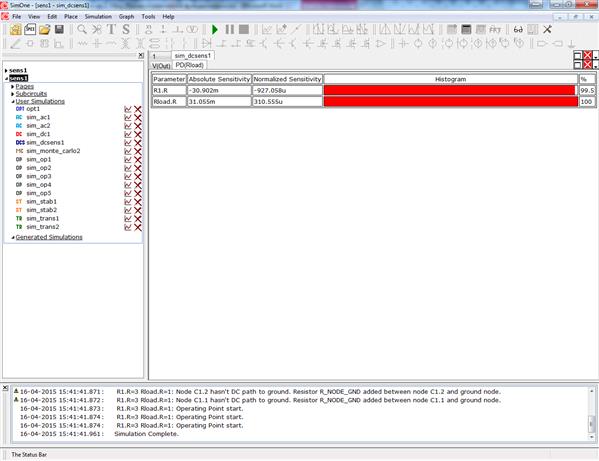
DC Sensitivity Analysis
DC Sensitivity analysis estimates the influence of circuit components, model parameters or temperature on DC output expressions in order to determine the most important variables.
SPICE syntax:
.SENS <expression1> <expression2> ...
<expression> is the output expression to estimate the sensitivity
Examples:
.SENS v(out)
.SENS {v(out)*I(Rout)} Vbe(Q1)
DC Sensitivity analysis parameters window
The sensitivity analysis results for each output expression are presented in an individual tab. In the table the absolute and normalised sensitivities are given. The histogram for the chosen sensitivity (absolute or normalised) is displayed. It can be switched with the corresponding button.
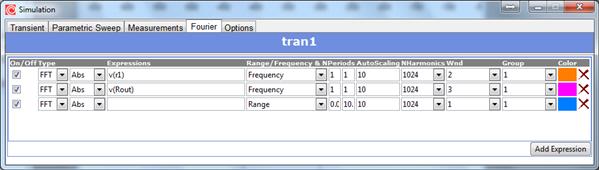
Fourier Transform
Fourier Transform can be now specified with:
- SPICE-command .FOUR;
- Fourier tab in Simulation parameters windows;
- Fourier Transform window during the post-processing.
.FOUR command can be written down if a SPICE-netlist is used or in a SPICE-text block in the Schematic editor.
SPICE/LTSPICE syntax:
.FOUR <frequency> [<number of harmonics>] [<number of periods>]
+<expression1> <expression2> ...
Examples:
.four 1KHz V(out)
.four 10KHz 3 V3(out)
Fourier Transform tab is available on the following analyses windows:
- Transient analysis
- Periodic Steady-State analysis
- AC analysis
Fixes
- Operational amplifier model
- Various minor bugs