The new version of SimOne 2.6 Beta is now available
New Features in SimOne
User Feedback
The feedback with a message to the developers can now be sent from inside SimOne. With the Help→Feedback menu entry “Contact developer” window is opened.
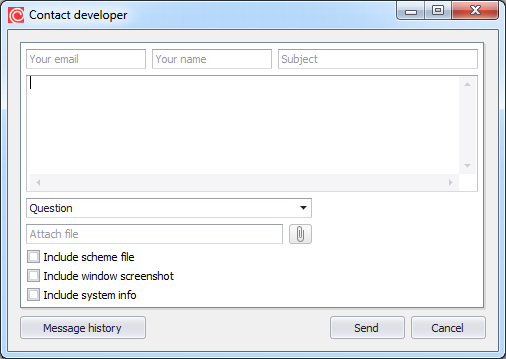
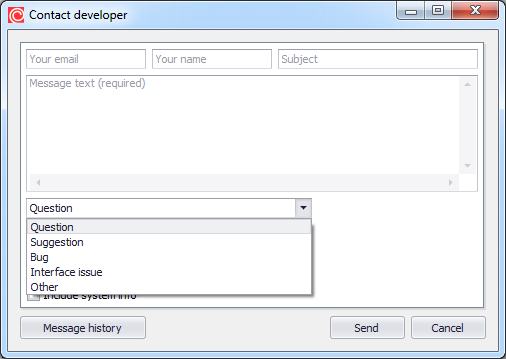
At the window there are optional fields for the sender email, name and the message subject. The message text cannot be left blanc. If the message type is Question, the email to send the response must be provided too.
The message types are:
- Question,
- Suggestion,
- Bug,
- Interface issue or
- Other.
Additional information can be send:
- Scheme (or netlist),
- Current SimOne view screenshot (without Contact developer window),
- System information,
- Any other file.
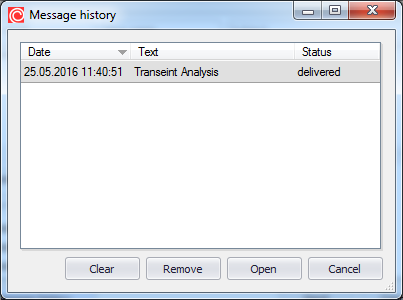
The sent messages are stored in the history. To view them click the Message history button.
Touchstone model and N-port devices
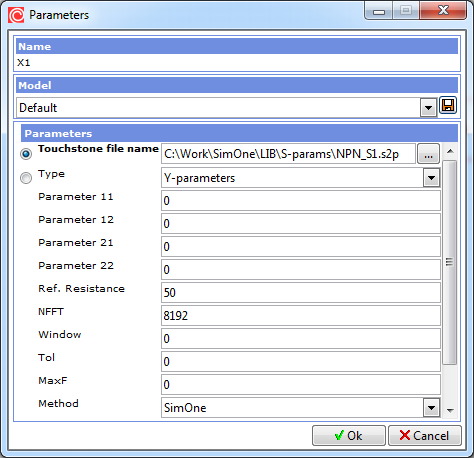
SimOne now supports N-port components, specified with S-, Z- and Y-parameters.
The parameters can be set either as expressions or as Touchstone files.
N-ports can be placed to the schematic either
- as a primitive (toolbar icons
 ) or
) or - a component from included libraries of Touchstone-models:
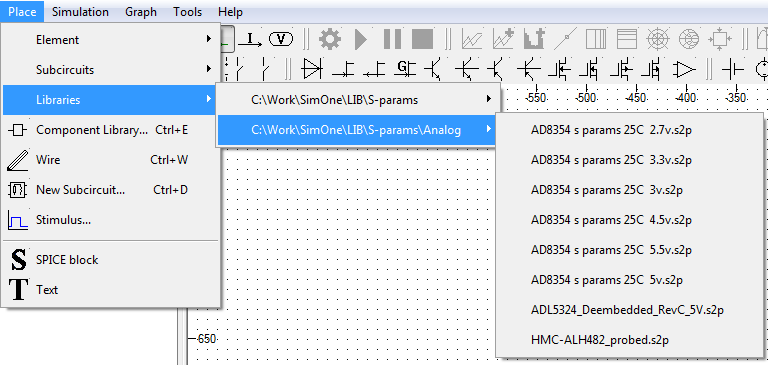
A new property is introduced for Laplace sources and N-ports: MaxF. It defines the Inverse Fourier Transform step applied to the specified element (or model) in simulations. Note: this doesn't define the element itself, but only the behaviour of computational algorithms.
Graphs
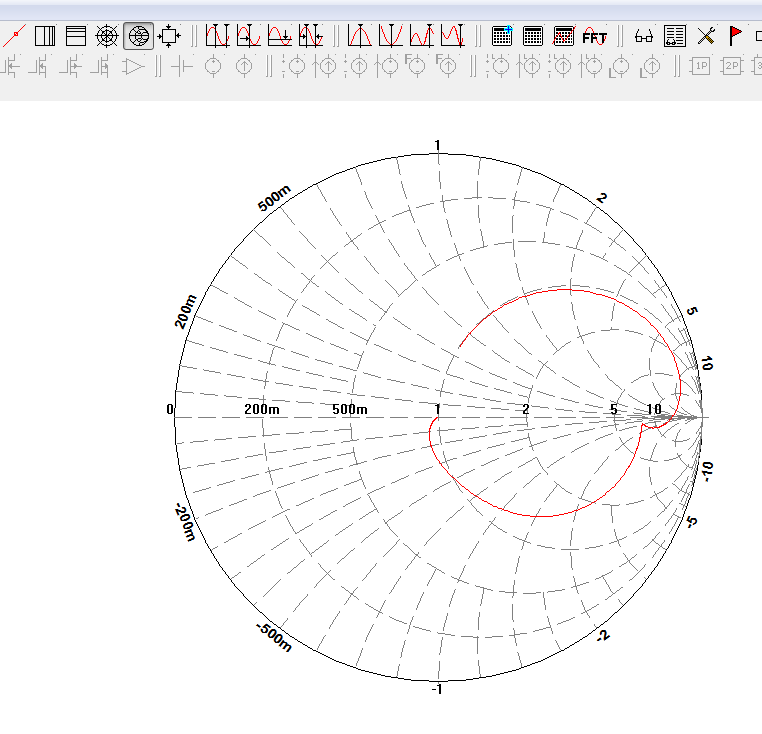
Graphs in AC analysis can be displayed on the Smith chart.
| Display the graph in polar coordinates |
Main menu: Graph→Mode→Polar Toolbar: |
| Display the graph on the Smith chart |
Main menu: Graph→Mode→Smith chart Toolbar: |
Export
AC analysis graphs can be exported in Touchstone and Freq formats.
Export to a Touchstone-file window:
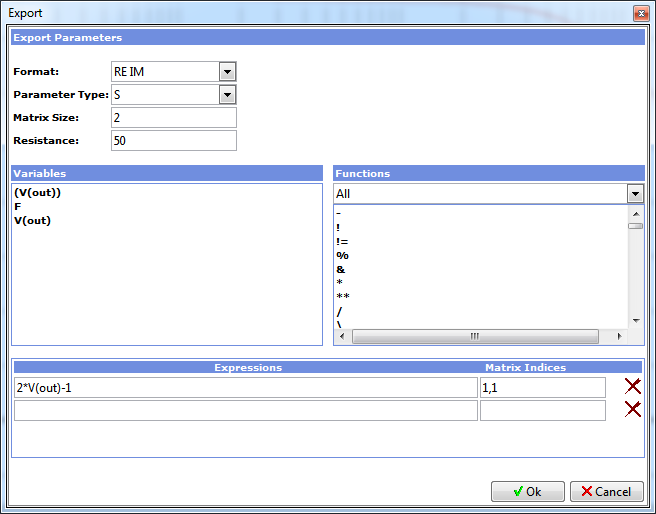
It contains the following parameters:
| Name | Description |
| Format |
The format to express complex numbers:
|
| Parameter type |
N-port parameters type. Can be on of the following:
|
| Matrix Size | N-port parameters matrix size |
| Resistance | Reference resistance (with which s-parameters are measured) |
| Variables | Variables available to be used in the expression to export |
| Functions | Functions available to be used in the expression to export |
| Expressions | Expressions to export |
| Matrix Indices | Indices in the N-port matrix. Are separated with comma ','. To set more than one pair for the same expression, separate them with semicolon ';' |
Export to a Freq-file window:
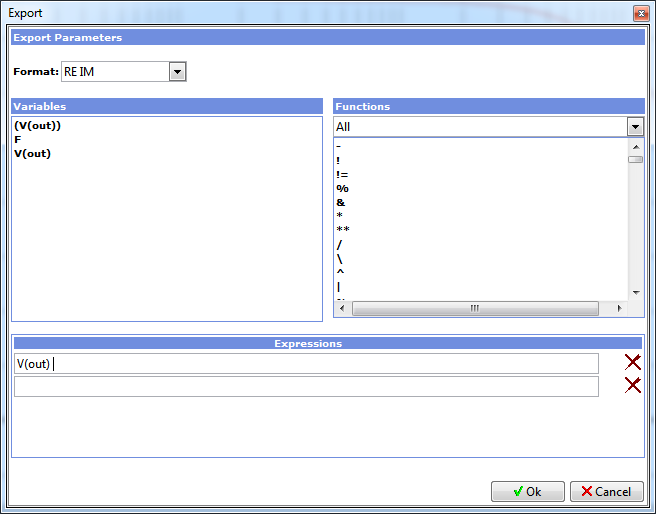
Рис. 20.16.5 Окно экспорта графика вFreq-файл
It contains the following parameters:
| Name | Description |
| Format |
The format to express complex numbers:
|
| Variables | Variables available to be used in the expression to export |
| Functions | Functions available to be used in the expression to export |
| Expression | Expression to export |
Mathematical expressions
The following measurements can now be used as expressions:
| Bandwidth | Bandwidth(expr, [level]) - Bandwidth of the expr at the level of dB. expr By default level = 3 dB. |
| СenterFrequency | СenterFrequency(expr, [level]) – the center frequency of the bandpass at the level of dB. By default level = 3 dB. |
| Cutoff_Highpass | Cutoff_Highpass (expr, [level]) – the upper bound of the bandpass at the level of dB. By default level = 3 dB. |
| Cutoff_Lowpass | Cutoff_Lowpass (expr, [level]) – the lower bound of the bandpass at the level of dB. By default level = 3 dB. |
| DeltaX | DeltaX(expr, y1, y2, [cross]) – the distance on the X axis between the point with Y coordinate and the point with Y coordinate , occurring for the th time. By default cross = 1. |
| DeltaY | DeltaY(expr, x1, x2 ) – the distance on the Y axis between the point with X coordinate and the point with X coordinate . |
| FallTime | FallTime(expr, y1, y2, [fall]) – the distance on the X axis between the point with Y coordinate and the point with Y coordinate on the th fall of the graph. By default cfall = 1. |
| firstY | firstY(expr) – returns the value of expr at the first point of the graph. |
| Frequency | Frequency(expr, y, [cross]) – returns the frequency of the expr measured by level y. Cross is the number of value y. By default cross = 1. |
| Inflection | Inflection(expr, [cross]) – returns the X coordinate of the point where the th inflection of the graph occurs. By default cross = 1. |
| lastY | lastY(expr) – returns the value of expr at the last point of the graph. |
| MaxY | MaxY(expr) – returns the maximum value of the expr. |
| MaxX | MaxX(expr) – returns the X coordinate of the maximum value of the expr. |
| MinY | MinY(expr) – returns the minimum value of the expr. |
| MinX | MinX(expr) – returns the X coordinate of the minimum value of the expr. |
| NX | NX(expr, [N=1]) – returns the X coordinate of the expr at the N-th point. |
| NY | NY(expr, [N=1]) – returns the value of the expr at the N-th point. |
| PeakX | PeakX(expr, [cross]) – returns the X coordinate of the function's peak point that occurs for the th time. By default cross = 1. |
| PeakY | PeakY(expr, [cross]) – returns the value of the function at the th peak. By default cross = 1. |
| Period | Period(expr, y, [cross]) – returns the frequency of the expr measured by level y. Cross is the number of value y. By default cross = 1. |
| Q_Bandpass | Q_Bandpass (expr, [level]) – returns the Quality factor at the level of dB. By default level = 3 dB. |
| RangeY | RangeY(expr,x1,x2) – difference between, max and min values of the expr in interval [x1;x2]. |
| RiseTime | RiseTime(expr, y1, y2, [rise]) – the distance on the X axis between the point with Y coordinate and the point with Y coordinate on the th rise. By default rise = 1. |
| Slope | Slope(expr, x) - returns the tangent of the slope angle at . |
| SlopeX | SlopeX(expr, slope, [cross]) – returns the X coordinate of the point at which the slope angle tangent equals , occurring for the th time. By default cross = 1. |
| ValleyX | ValleyX(expr, [cross]) - returns the X coordinate of the th valley of the expr. By default cross = 1. |
| ValleyY | ValleyY(expr, [cross]) - returns the value of the expr at the th valley. |
| Width | Width(expr, y, []) - the distance on the X axis between the two closest points with Y coordinate , occurring for the th time. By default cross = 1. |
| XatY | XatY(expr,y,cross,[crosstype]) - returns the X coordinate of a point with Y coordinate occurring for the th time with the specified configuration: on the rise, on the fall or wherever there is a crossing. |
| YatX | YatX(expr,x) - returns the value of the expr at x. |
However, they can be used in expressions to plot as graphs, but not in descriptions of schematic components.
Fixes
- Metric suffixes interpretation errors are fixed.


